The problem
The book holds about 900 properties, in states from active account to prospect. The map brings together territory, account ownership and the places where customers already sit close together. Unassigned properties, missing map pins and pins that fall away from the address are findings a name-sorted list gives no way to see.
The previous process
As recorded in the project brief, not measured: an export from the system was pasted into Google My Maps and colored by ZIP code, and a territory or ownership question was answered by reading that export. ZIP boundaries and sales territories are drawn differently, so ZIP color only approximated the territories. A pasted export holds whatever was true on the day someone pasted it, and nothing in that process refreshed it.
Nothing records how often it was rebuilt or how long a rebuild took. Who read it is not recorded either. No before-and-after comparison is available, and none is claimed below.
My role
I defined the operating problem, specified the system, directed the build and reviewed the result. AI agents wrote most of the code under my review gates.
I set the property states, assignment rules, property-card contents and exclusions. The specification excluded AR balances, crew location and customer-facing access.
What was built
- Coverage map. Shipped. Property marks colored by state, boundary fills carrying customer counts, hexbin density when zoomed out, and a header carrying freshness clocks plus seven counts: active, contracted with no work, dormant, prospect, unassigned, missing pin, bad pin.
- Operations layer. Shipped. The property card, the per-territory rollup, the rep-by-territory matrix, and the unassigned, missing-pin and bad-pin tables.
- Nightly brief. Shipped, carrying aggregates only. The push that would deliver it to a phone ships disarmed.
- Route fit, phase one. Shipped, using straight-line distance. Phase two, which would use drive minutes, is design only and has not been built.
- Follow-up and recovery views. Shipped.
- Single-question view and owner editor. Shipped. The release record includes an installed assignment and served readback; this is delivery evidence, not an adoption total.
- Always-in-sync handling for grouped accounts. Shipped.
- Owner pack. Drafted, not ratified, not shipped.
The source record describes the publish schedule: an assignment run each night at 08:50 UTC writes append-only rows and lays down the page and its data files; the page is re-rendered on every five-minute mirror pass; an open page checks a status file every 60 seconds and picks up the new render. One access-limited route serves it, and the property card deep-links into the reader’s own Aspire session rather than copying records out of it.
How it works
A reader moves from the full account book to an owner filter, then opens a property card to inspect its context and source freshness. Coverage views expose unassigned accounts and gaps. An ownership change follows the recorded approval path before it becomes the operating assignment.
Figures and their status
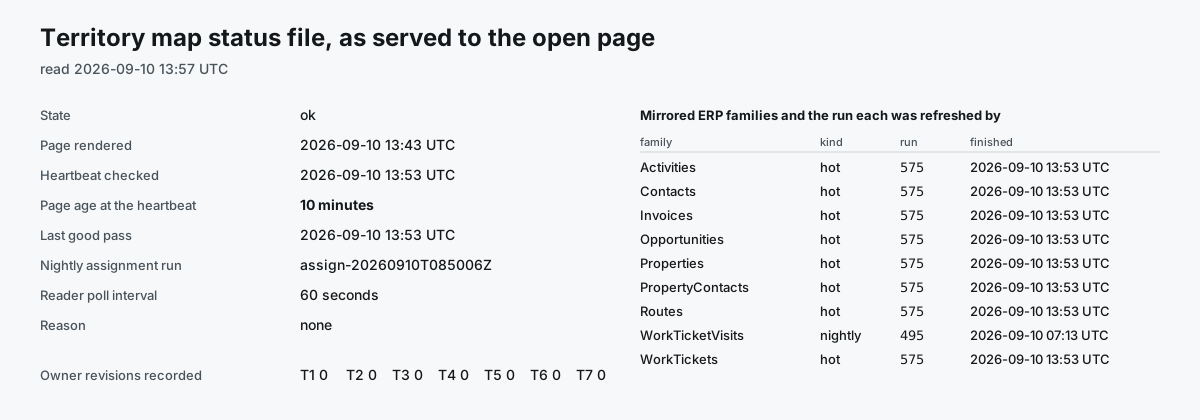
Figure unavailable.
Evidence
| Evidence | Dated account |
|---|---|
| Deployed | The source account records a nightly assignment run and five-minute refresh. |
| Used | Two readers were reported. Current owner-decision totals have not been independently checked. |
| Measured | No view count, session length or measurement of effect. |
Deployment record. The dated source account describes the nightly assignment run and five-minute page refresh. The September release record also includes an installed owner assignment and served readback.
Use. Two readers were reported in the source account. That is not a measured adoption count. Current owner-decision totals have not been independently checked for this case study.
Effect. No measured business outcome is available. The record contains no page-view or session-duration instrumentation.
Observed results
Outcome not yet measured.
What would be measured, if a baseline were captured first: the unassigned and bad-pin counts, which should fall and stay down; the number of owner decisions recorded through the editor instead of settled in conversation; the number of properties carrying a 180-day gap in CRM activity; and how many people read the page. No baseline exists today for any of them.
What this does not show
- Any public visual demonstration uses invented records. Customer names, addresses, coordinates, account owners, financial records and contact details are not included in this case study.
- Two readers were reported; current adoption and business effect have not been measured for this case study.
- Route fit is straight-line distance. Drive time is not modeled, so the day’s route line is an approximation.
- The nightly brief carries aggregates only, so it will not answer a question about a single property.
- A historical page render was about 3.9 MB. Its size and dependence on the map service matter on a weak connection.
- Access is limited to two link holders inside the company. The page is not customer-facing and is published nowhere public.
- The basemap comes from Google, which receives the map viewport, the referring origin and anything typed into the place-search box.
- The map is only as current as the mirror it reads from, and the freshness clocks exist so a reader can see when that stops being true.
- The previous process is described as the project brief records it. It was never measured, so nothing here is a before-and-after result.
Relevant next action
A fixed-scope build over an ERP already in place: the states, the assignment rules, the exclusions, and the page that shows them. What a first engagement covers
The reporting platform built for the same company, with the investigation paths behind each figure. Business metrics and reporting platform
Walkthrough
Synthetic demonstration with fictional data. Stock synthetic narration.
If playback is unavailable, read or download the transcript below.
Read the full transcript
Synthetic demonstration with fictional data. Stock synthetic narration. Which accounts need attention? This territory view uses fictional accounts and figures. Filter by account owner to review their coverage. The counts update with the view. Half the book highlights the accounts representing at least half of recorded won contract value. The change summary points to accounts that changed between runs. Open an account to inspect its activity and operating context. The same workflow can be adapted to another CRM, with its own source mapping and data definitions.